Connect Score v1.0.0 Validation Report
Executive summary
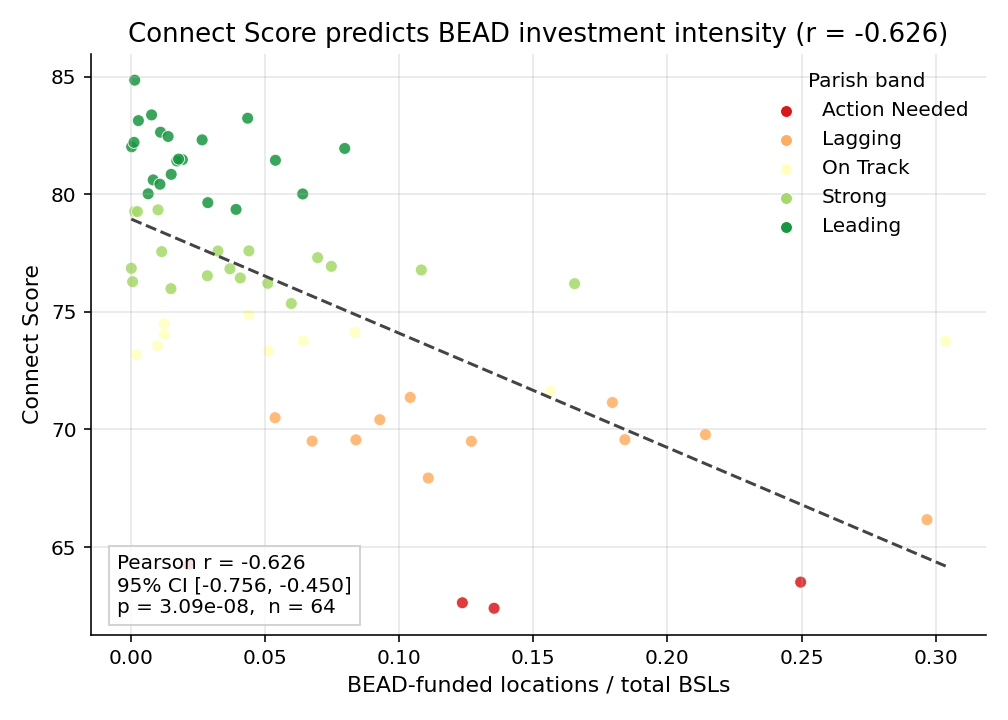
- Headline finding (Layer 3, criterion validity): Connect Score predicts where Louisiana invested $1.4B in BEAD funding (r = -0.626, 95% CI [-0.756, -0.450], q = 1.55e-07 after BH FDR correction; n = 64). Effect size: large.
- Convergent validity (Layer 2): Score correlates as theory predicts with educational attainment (r = 0.470) and rurality (r = -0.463). Poverty signal is r = -0.368. Poverty signal is moderate and largely overlaps with rurality (see colinearity diagnostic).
- Methodology: Connect Score is a formative composite of three constituent dimensions (Availability, Affordability, Adoption). Component dimensions are appropriately distinct (max pairwise r = 0.314, well below the 0.85 collinearity ceiling).
Methodology framing
Connect Score is a formative composite index, not a reflective psychometric scale. Constituent dimensions are aggregated to form the digital-equity construct rather than to reflect a single latent trait (Diamantopoulos & Winklhofer 2001). This means components are by design distinct dimensions of digital equity, not items expected to inter-correlate. Standard reliability statistics for reflective scales (Cronbach's alpha) are not the appropriate validity test; we report it for completeness but rely on indicator collinearity (Layer 1 max pairwise correlation), convergent validity (Layer 2), and criterion validity (Layer 3) to establish trustworthiness.
Layer 1, indicator collinearity
The relevant Layer 1 test for a formative composite: do the three components measure distinct things?
- Max pairwise correlation: r = 0.314 (threshold ≤ 0.85, PASS, effect size medium). Components are not redundant.
- Pairwise: avail/afford = 0.314, avail/adopt = 0.126, afford/adopt = -0.225.
- Reported for completeness, Cronbach's alpha = 0.225. Not applicable for formative indices; do not interpret as a reliability failure.
Layer 2, convergent validity
Connect Score should correlate as theory predicts with three independent signals (none used as score inputs). For each test we report Pearson r, Fisher-z 95% confidence interval, unadjusted p, BH FDR-adjusted q across the five inferential tests in Layers 2 and 3 (poverty, education, rurality, BEAD, unserved-unfunded), Cohen's effect-size label, and direction match against prediction.
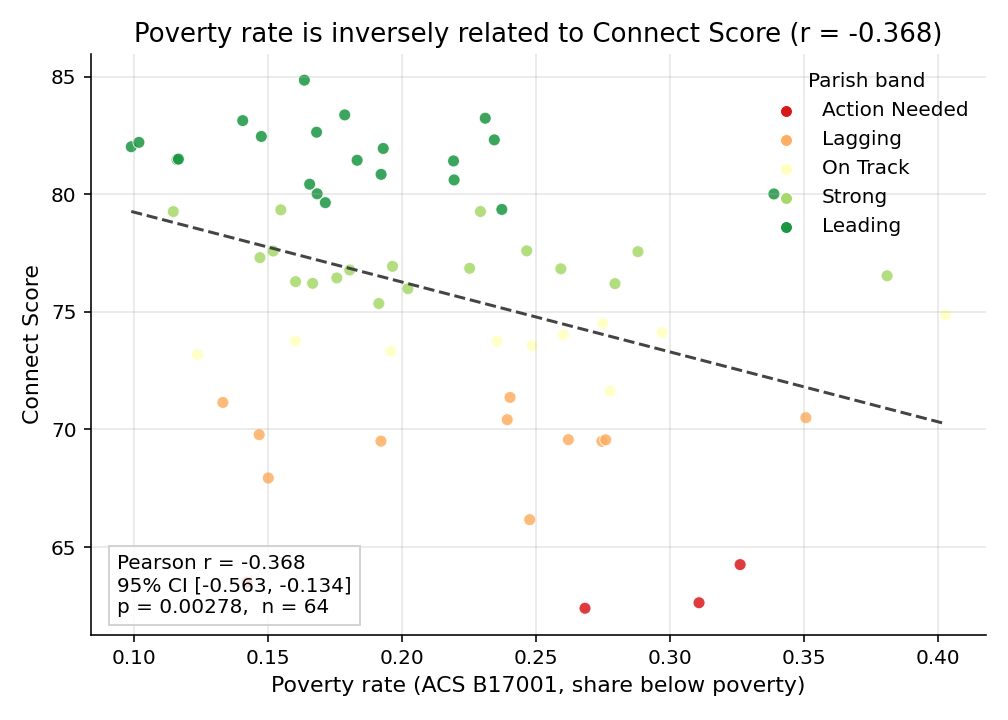
- Poverty rate (predicted negative): r = -0.368, 95% CI [-0.563, -0.134], p = 0.00278, q = 0.00347, n = 64. Effect size: medium. Direction matches prediction. Misses the |r| ≥ 0.4 magnitude threshold.
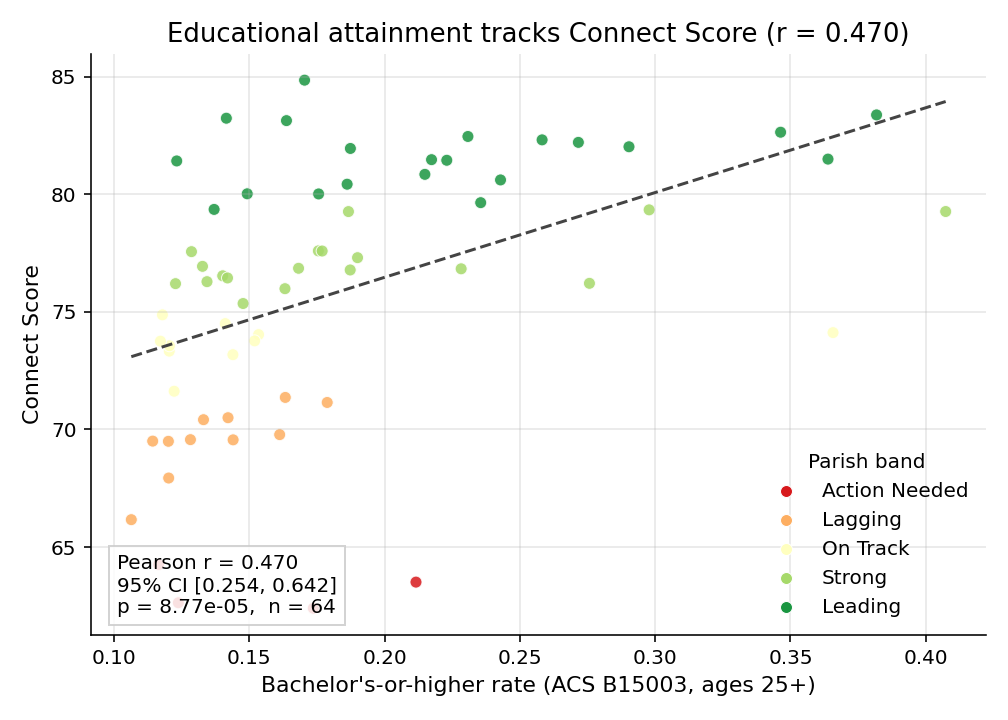
- Bachelor's-or-higher rate (predicted positive): r = 0.470, 95% CI [0.254, 0.642], p = 8.77e-05, q = 0.000198, n = 64. Effect size: medium. Direction matches prediction. PASS at the magnitude threshold |r| ≥ 0.4.
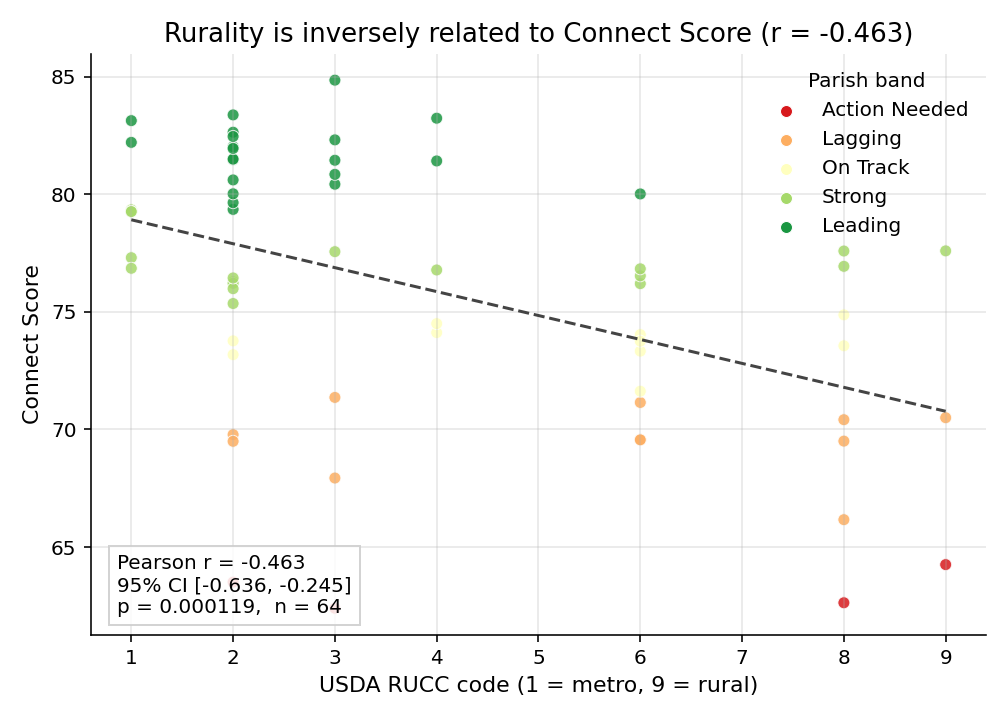
- USDA RUCC rurality (predicted negative): r = -0.463, 95% CI [-0.636, -0.245], p = 0.000119, q = 0.000198, n = 64. Effect size: medium. Direction matches prediction. PASS at the magnitude threshold |r| ≥ 0.4.
Colinearity diagnostic (poverty vs rurality)
Poverty rate and rurality both correlate with Connect Score. The Pearson correlation between poverty and rurality themselves is r = 0.607 (95% CI [0.425, 0.742], n = 64). The partial correlation Connect Score x poverty | rurality is r = -0.124, indicating poverty's marginal signal beyond rurality is weak. Poverty's marginal contribution beyond rurality is weak; the two signals are largely redundant. Rurality alone explains most of the score-poverty association in this sample.
Layer 3, criterion validity (the headline)
Does the Connect Score predict where Louisiana actually invests?
- BEAD investment intensity (primary): r = -0.626, 95% CI [-0.756, -0.450], p = 3.09e-08, q = 1.55e-07, n = 64. Effect size: large. PASS at strong threshold (r ≤ -0.5).
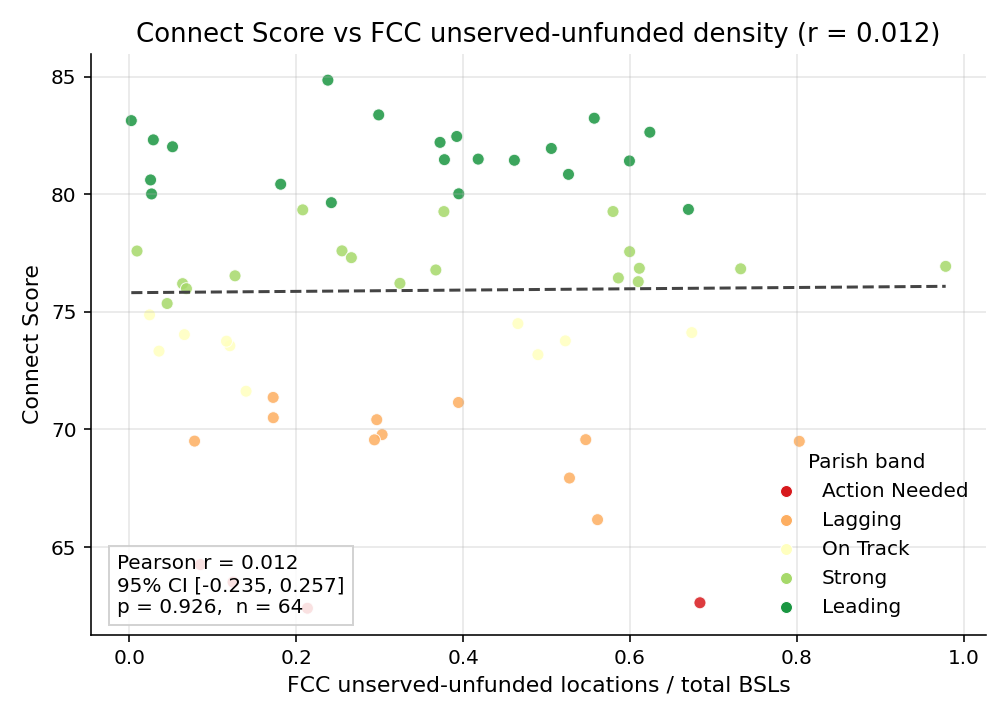
- FCC unserved-unfunded density (secondary): r = 0.012, 95% CI [-0.235, 0.257], p = 0.926, q = 0.926, n = 64. Effect size: trivial. No signal (|r| < 0.1).
Headline interpretation
The Connect Score predicts the same parishes Louisiana's broadband office prioritized for $1.4B in BEAD investment. The criterion-validity correlation is large (r = -0.626) and survives BH FDR correction (q = 1.55e-07) across all 5 inferential tests in this validation. This validates the score against the state's own operational decisions independent of any input the score uses.
The unserved-unfunded density test does not produce a signal (r = 0.012). This is consistent with the BEAD result: unserved-unfunded locations represent the residual of "where federal/state funding has not yet been committed," and Louisiana's BEAD allocation has covered most of that residual. We report the null result transparently rather than treating it as a failure.
Limitations
- Sample size: n = 64 parishes. Confidence intervals reflect this. Findings are state-specific and do not generalize beyond Louisiana without re-validation.
- Methodology version: v1.0.0 is the initial public version. Subsequent versions (v1.1+) may revise weights, components, or band breakpoints based on stakeholder feedback.
- BDC vintage drift: a portion of BEAD-funded location IDs from Exhibit C are absent in the J25 BDC vintage we use as a denominator. Parish-level r is unaffected (numerator and denominator share the J25 vintage), but reproducibility against ConnectLA's exact Exhibit C vintage requires obtaining the matching BDC version.
- Affordability proxy: structural affordability uses ACS B19001 income brackets at the $30K boundary as a 2%-of-monthly-income proxy for typical $50/month plan affordability. This is a coarse proxy; finer-grained income data would tighten the signal.
- Cronbach's alpha is not applicable: the value reported (0.225) is not interpretable as reliability for a formative composite index, per the methodology framing above.
Reproducibility
- Methodology version: v1.0.0
- Inputs vintage: acs=2018-2022, fcc_bdc=2025-06-30, lifeline=2025-Q4
- Score-input file SHA256 hashes: see
exports/connect-scores-v1.0.0.jsoninput_hashesfield - Validation-input file SHA256 hashes:
- acs_b15003.json: c9bcb98783abb7b3e0ec0aaef230226f8e858e9bd0cf4a65a4318c6812f97fb2
- acs_b17001.json: 2c2df9c58e3ce6200950f099d353deceedb9cab6f8e632010c19864cad2e304b
- bdc_22_Cable_fixed_broadband_J25_31mar2026.csv: 349e52ad78d84361a06447220930e30cd82024fffc87759352f3ceef108bf37d
- bdc_22_Copper_fixed_broadband_J25_31mar2026.csv: 4ddb86937104ca6ab003d7d7c67435d40e4816751f00bd2b05aa22d6bc0d3a0c
- bdc_22_FibertothePremises_fixed_broadband_J25_31mar2026.csv: 2bda591fd39be2d57470d9325fb18bf8d675ad63fa1271b043b2ca1a0e03cba6
- bead_locations.csv: 564a7a21495e317fcde69634b6c2ee146fae6228123e1e6597a410bdc06824b2
- rucc_2023.csv: bc65b7d4ff352c3bddf3e3d02bf42336cf86635e5c2087e5e875239f32e1de7f
- unserved_unfunded.csv: f9a547713052251de2c060a77933fdb1938fe8c00c0970f65de45e2ab7c6c272
- Code:
git log --onelinein this repo - Methodology spec:
docs/superpowers/specs/2026-04-25-connect-score-redesign-design.mdin the consumer app